 您将要创建 的内容
SVG 是一种强大而灵活的图形格式,非常适合网络媒体。与 JPG、PNG 或 GIF 等光栅图像格式不同,svg 是基于矢量的,由“真实”对象组成,您可以以任何您想要的方式选择和操作这些对象。因此,即使使用一些基本的脚本,静态图像也可以动画化并进行交互。这将是本教程的主题。
SVG 和 vue:完美搭配
为了演示如何编写 SVG 脚本,我选择了Vue.js。我选择的原因是,在我看来,SVG 和 Vue 是完美的搭配。首先,Vue 支持开箱即用的 SVG。其次,SVG 和 html 一样是基于 XML 的,因此我们可以将 Vue 的反应性系统应用到 SVG 上,并以与使用 HTML 模板相同的简单方便的方式使其交互。
Vue 和 SVG 集成快速入门
在我们讨论下面将探讨的两个用例之前,让我给你一个关于 SVG 和 Vue 集成工作方式的线索。
首先,我们创建一个基本的 HTML 文件并包含 Vue框架。然后,我们将要操作的 SVG 放入其中。
<div id="app">
  <svg width="400" height="300">
    <rect @click="toggleStroke" x="10" y="10" :width="width" :height="height" :fill="color" stroke="green" :stroke-width="stroke"></rect>
  </svg>
</div>
在这里,我们有一个矩形对象,其属性绑定到 Vue 实例中的数据对象。我们还有一个点击事件监听器,它将调用该toggleStroke()方法。因此,当我们单击矩形时,笔划将被切换。
这是Vue代码:
new Vue({
  el: '#app',
  data: {
    color: 'orange',
    width: 100,
    height: 100,
    stroke: 0
  },
  methods: {
    toggleStroke(){
      this.stroke == 0 ? this.stroke = 5 : this.stroke = 0
    }
  }
})
如您所见,将 Vue 和 SVG 结合起来非常容易。现在,让我们探索一些更现实和有用的例子。
示例一:创建倒数计时器小部件
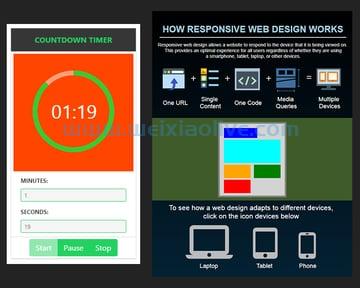
在第一个示例中,我们将创建一个倒计时小部件。它将允许用户设置给定时间段的分钟和秒,并且在启动时,计时器将以循环进度显示剩余时间。
为了绘制进度并为其设置动画,我们将使用 SVG 圆形对象及其stroke-dasharray属性。您可以在此处阅读有关 SVG 循环进度技术的信息。此外,为了添加一些结构和漂亮的样式,我们将使用Bulma 的Card 组件。因此,请确保您已将框架添加到您的文件中。

我们首先添加一个卡片组件,然后在里面放一个带有我们小部件标题的标题。
<div id="app">
  <div class="card">
    <header class="card-header has-background-grey-darker">
      <p class="card-header-title has-text-success">COUNTDOWN TIMER</p>
    </header>
  </div>
</div>
接下来,我们使用卡片的图像部分来放置我们的 SVG。
<div class="card-image">
  <svg xmlns="https://www.w3.org/2000/svg" viewbox="0 0 260 250" width="260" height="250">
    <rect x="5" y="5" width="250" height="250" fill="orangered" />
    <circle cx="130" cy="125" r="80" stroke="lightsalmon" stroke-width="10" fill="none" />
    <circle cx="130" cy="125" r="80" stroke="limegreen" :stroke-dasharray="dasharray" stroke-offset="600"
      stroke-width="10" fill="none" transform="rotate(270,130,125)" />
    <text x="84" y="140" fill="white" font-size="40">{{ minute | formatTime }}:{{ second | formatTime }}</text>
  </svg>
</div>
在这里,我们有一个矩形作为背景。我们使用两个圆圈来创建循环进度。我们定位它们,使它们完全重叠。我们将fill第一个圆圈的属性设置为,none并且只使用它的笔画作为进度的轮廓。
为了创建画圆的错觉,我们将 stroke-dasharray第二个圆的属性绑定到dasharray()计算属性,稍后我们将创建该属性。此外,我们希望绘图的起点在 12 点钟位置,而不是默认的 3 点钟位置。为此,我们使用transform属性旋转点。最后一个对象是文本,我们将其定位在圆的中心。为了正确显示时间,使用前导零,我们应用 formatTime()过滤器,稍后我们将创建它。
接下来,我们需要添加分钟和秒的控件。
<div class="card-content">
  <div class="field is-horizontal">
    <div class="field-label">
      <label class="label is-size-7">MINUTES:</label>
    </div>
    <div class="field-body">
      <div class="field">
        <div class="control">
          <input class="input is-success is-small" :disabled="state==='started' || state==='paused'" @change="updateTime"
            v-model="minute" type="number" name="minutes" min="0" max="59" step="1">
        </div>
      </div>
    </div>
  </div>
  <div class="field is-horizontal">
    <div class="field-label">
      <label class="label is-size-7">SECONDS:</label>
    </div>
    <div class="field-body">
      <div class="field">
        <div class="control">
          <input class="input is-success is-small" :disabled="state==='started' || state==='paused'" @change="updateTime"
            v-model="second" type="number" name="seconds" min="0" max="59" step="1">
        </div>
      </div>
    </div>
  </div>
</div>
这里重要的控件是输入,我们使用v-model指令将其与相应的 Vue 属性绑定。state当设置为started或时,我们也会禁用它们paused。最后,我们添加一个更改事件***器,它将调用该 updateTime()方法。
最后,我们添加按钮来控制计时器。
<footer class="card-footer">
  <div class="buttons has-addons card-footer-item">
    <button class="button is-success" :disabled="state==='started' || second==0 && minute==0" @click="start"><span>Start</span></button>
    <button class="button is-success" :disabled="state!=='started'" @click="pause">Pause</button>
    <button class="button is-success" :disabled="state!=='started' && state !== 'paused'" @click="stop">Stop</button>
  </div>
</footer>
在这里,我们再次为按钮添加点击事件***器和一些条件,以便在不需要时将其禁用。
到目前为止,我们需要一些css来纠正计时器某些部分的间距和对齐方式。
#app {
  width: 260px;
  margin: 10px;
}

.card-header-title {
  justify-content: center;
}

.card-content {
  padding: 4px 20px 8px;
}

.card-footer-item {
  padding: 4px;
}
现在,是时候将 Vue 代码添加到方程式中了。
new Vue({
  el: '#app',
  circumference: 2 * Math.PI * 80,
  data: {
    state: 'stopped',
    minute: 0,
    second: 0,
    progress: 0,
    timeInSeconds: 0
  },
  computed: {
    dasharray(){
      return this.progress + " " + this.$options.circumference
    },
  }
})
首先,我们在数据对象中定义必要的属性,并添加圆的周长作为 Vue 实例的自定义选项。后者是因为我们需要circumference是静态的而不是被动的。我们创建dasharray()计算来计算stroke-dasharray属性的值。
现在,让我们添加方法:
methods: {
  updateTime(){
  this.timeInSeconds = Number(this.minute) * 60 + Number(this.second)
},
start() {
  this.state = "started";
  if (this.progress == 0){
    this.progress = this.$options.circumference;
  }
  this._tick();
  this.interval = setInterval(this._tick, 1000);
},
pause() {
  this.state = "paused";
  clearInterval(this.interval);
},
stop() {
  this.state = "stopped";
  clearInterval(this.interval);
  this.minute = 0;
  this.second = 0;
  this.progress = 0;
},
_tick: function() {
  //if second is 0 and minute is 0, clear the interval
  if (this.minute == 0 && this.second == 0){
    this.stop()
  }
  //update progress
  let delta = (this.$options.circumference / this.timeInSeconds)
  if ((this.progress - delta) < (delta / 2)){
    this.progress = 0
  } else {
    this.progress -= delta
  }
  //if second is not 0, just decrement second
  if (this.second !== 0) {
    this.second--;
    return;
  }
  //if second is 0 and minute is not 0, decrement minute and set second to 59
  if (this.minute !== 0) {
    this.minute--;
    this.second = 59;
  }
}
}每次值更改时,该updateTime()方法都会更新 属性的值。timeInSeconds
该方法每秒 start()更改state一次started并调用该方法。_tick()
该_tick()方法处理 , 和 props 的progress正确minute更新second。
该pause()方法通过清除间隔来更改和停止时钟state。paused
该stop()方法将 更改state为stopped,停止时钟,并重置progress、minute和secondprops。
最后,我们添加formatTime()过滤器来处理时间的正确显示。
filters: {
  formatTime: function(value) {
    if (value >= 10) {
      return value;
    }
      return "0" + value;
  }
}就是这样!我们成功地使用了 Vue 的反应特性将我们的静态 SVG 绘图转换为交互式倒计时计时器。让我们继续下一个示例。
示例二:创建 SVG 信息图
在这个例子中,我们将创建一个小的信息图来展示什么是响应式网页设计以及它是如何工作的。感谢 Vue,我们将能够为 SVG 插图制作动画,并使其更加逼真和引人入胜。

我在illustrator中创建了信息图的静态部分,然后将其导出为 SVG。然后我手动添加了动态部分。动态部分是三个线框,它们模拟如何在不同设备上查看相同的网页设计。现在让我们创建它们。
首先,让我们创建不同线框所需的数据对象。
const laptop = {
  r1: {x: '100', y: '335', width: '400', height: '220'},
  r2: {x: '115', y: '350', width: '200', height: '30'},
  r3: {x: '115', y: '390', width: '370', height: '70'},
  r4: {x: '115', y: '470', width: '110', height: '40'},
  r5: {x: '245', y: '470', width: '110', height: '40'},
  r6: {x: '375', y: '470', width: '110', height: '40'},
}

const tablet = {
  r1: {x: '200', y: '335', width: '200', height: '220'},
  r2: {x: '215', y: '350', width: '100', height: '30'},
  r3: {x: '215', y: '385', width: '170', height: '70'},
  r4: {x: '215', y: '460', width: '80', height: '40'},
  r5: {x: '305', y: '460', width: '80', height: '40'},
  r6: {x: '215', y: '505', width: '80', height: '40'},
}

const phone = {
  r1: {x: '220', y: '335', width: '160', height: '220'},
  r2: {x: '225', y: '340', width: '150', height: '30'},
  r3: {x: '225', y: '375', width: '150', height: '70'},
  r4: {x: '225', y: '450', width: '150', height: '30'},
  r5: {x: '225', y: '485', width: '150', height: '30'},
  r6: {x: '225', y: '520', width: '150', height: '30'},
}

new Vue({
  el: '#app',
  data: {
    d: {
      r1: {x: '100', y: '335', width: '400', height: '220'},
      r2: {x: '100', y: '335', width: '400', height: '220'},
      r3: {x: '100', y: '335', width: '400', height: '220'},
      r4: {x: '100', y: '335', width: '400', height: '220'},
      r5: {x: '100', y: '335', width: '400', height: '220'},
      r6: {x: '100', y: '335', width: '400', height: '220'},
    }
  },
})
每个线框由六个矩形组成,因此对于每个设计,我们创建一个具有必要值的单独数据对象。在 Vue 实例中,我们创建另一个,它将作为基础对象。
现在,让我们创建线框所需的 SVG 矩形并将它们的属性绑定到数据值:
<rect :x="d.r1.x" :y="d.r1.y" :width="d.r1.width" :height="d.r1.height" fill="lightgrey" stroke="grey" stroke-width="5"/>
<rect :x="d.r2.x" :y="d.r2.y" :width="d.r2.width" :height="d.r2.height" fill="blue" />
<rect :x="d.r3.x" :y="d.r3.y" :width="d.r3.width" :height="d.r3.height" fill="cyan" />
<rect :x="d.r4.x" :y="d.r4.y" :width="d.r4.width" :height="d.r4.height" fill="orange" />
<rect :x="d.r5.x" :y="d.r5.y" :width="d.r5.width" :height="d.r5.height" fill="green" />
<rect :x="d.r6.x" :y="d.r6.y" :width="d.r6.width" :height="d.r6.height" fill="red" />
接下来,我们在Tween.js的帮助下创建动画方法 。因此,请确保您已将该库添加到您的文件中。我们使用 Vuecreated()生命周期钩子将线框从基础对象初始动画到笔记本电脑设计线框。
created(){
  this.anim(laptop)
},
methods: {
  anim(val){
  function animate(time) {
    requestAnimationFrame(animate);
    TWEEN.update(time);
  }
  requestAnimationFrame(animate);
  new TWEEN.Tween(this.d.r1).to(val.r1, 1000).start();
  new TWEEN.Tween(this.d.r2).to(val.r2, 1000).start();
  new TWEEN.Tween(this.d.r3).to(val.r3, 1000).start();
  new TWEEN.Tween(this.d.r4).to(val.r4, 1000).start();
  new TWEEN.Tween(this.d.r5).to(val.r5, 1000).start();
  new TWEEN.Tween(this.d.r6).to(val.r6, 1000).start();
  }
}
现在,我们通过在设备图标上方放置透明 SVG 矩形来为设备图标添加叠加层。这样,点击区域将包含整个图标,而不仅仅是它们的轮廓。最后,我们添加 click 事件***器,它将anim()使用所选设计调用方法。
<rect @click="anim(laptop)" x="95" y="640" width="155" height="110" fill="transparent"/>
<rect @click="anim(tablet)" x="295" y="645" width="85" height="105" fill="transparent"/>
<rect @click="anim(phone)" x="435" y="660" width="60" height="90" fill="transparent"/>
所以现在,当我们打开信息图时,笔记本电脑的设计会呈现出柔和的动画效果,当我们点击不同的设备图标时,线框设计也会相应地更新为流畅的动画效果。酷吧?
结论
如您所见,SVG 与 Vue 结合使用可以非常强大和灵活。Vue 使访问和操作 SVG 对象并使其完全交互变得超级容易。通过这种方式,您可以为静态 SVG 图形赋予生命,并使它们变得动态且对用户来说更令人愉悦。这种参与可以显着改善用户体验和网站或应用程序的整体外观。



![如何删除Word中的空白页[4种简单方法] 如何删除Word中的空白页[4种简单方法]](https://www.weixiaolive.com/en/zb_users/upload/2023/07/20230702124855168827333590644.png)

